You are at the kitchen table with the laptop open and a cup of something that went cold an hour ago.
You are reading about derivatives for the third time this month. Binomial trees, risk neutral probabilities, the hedge ratio, why the up factor is what it is. You have understood it twice already and it has slipped both times.
You are reading it because your last mock put that chapter in red, and red means weak, and weak means read it again. That is the deal. That is what you signed up for when you registered.
Here is what nobody tells you at 11:40 on a Tuesday.
There is a decent chance that chapter was never your problem. And the marks that are actually draining out of your score, the ones that will decide this in six weeks, are coming from a chapter your report card left in unremarkable amber, and which you have not opened since.
You are not underworking. You are working precisely, carefully, and in the wrong place.
The question we went looking for
We kept seeing the same pattern. A candidate takes a mock, gets a weak areas list, revises it honestly for a fortnight, takes another mock, and lands within a couple of marks of where they started.
Not everyone. But often enough that “just put in more hours” stopped being a satisfying answer.
So we went digging, and the answer turned out to be sitting inside the report card itself. Not in the numbers it showed. In the question it was answering.
Every mock test platform in this market, ours included until recently, tells you which chapters you got wrong.
Not one of them tells you why.
And that turns out to matter enormously, because there is not one way to get a question wrong. There are four.
Four ways to lose the same mark
Picture four candidates. All four get the same question wrong. All four get the identical red flag on the identical chapter.
The first one did not know it. Never properly learned it. The material is the problem.
The second one knew it perfectly well. She could explain it to you over coffee. But in the hall, with the clock running, she could not pull it out of her head fast enough, second guessed herself, and picked the wrong option. She does not have a knowledge gap. She has a retrieval speed gap.
The third one knew it and was racing. Read the question too fast, missed the word “not”, answered a question that was not asked.
The fourth one never saw the question. Ran out of time on page four and never reached page seven. She might have got it right. Nobody will ever know, least of all her.
Four people. One red flag. Four completely different problems.
Now read the advice their report cards gave them. All four were told to revise the chapter.
Revision helps exactly one of them. For the second, rereading is close to useless, because more understanding is not what she lacks. For the third, it is worse than useless, because it sends him away from the habit that is actually costing him. For the fourth, it is beside the point entirely.
This is why two honest evenings can produce no improvement at all. Not because you did not work. Because the work was aimed at the wrong thing.
The thing nobody was measuring
So how do you tell four people apart when their scores are identical?
You measure the one thing every mock test throws away.
Time.
Not the total on the clock at the end. Time per question. Which questions you laboured over, which you flew past, and which you came back to twice because something about them nagged at you.
That number is the missing half of the diagnosis. Score tells you what happened. Time tells you why.
A chapter you got 40 percent on in 25 minutes and a chapter you got 40 percent on in 4 minutes are not the same chapter. One of them needs studying. The other needs you to slow down and read the question properly. Until now, no report card could tell you which was which, because none of them were watching the clock.
So we started watching it.
The two by two
Score alone could never separate your four candidates. Time alone could not either. A candidate who is slow might be struggling or might be careful. You cannot tell.
But put the two together, on two axes of the same chart, and they fall apart from each other instantly.
That chart is a two by two matrix, and it is now the first thing you see when you end a paper.
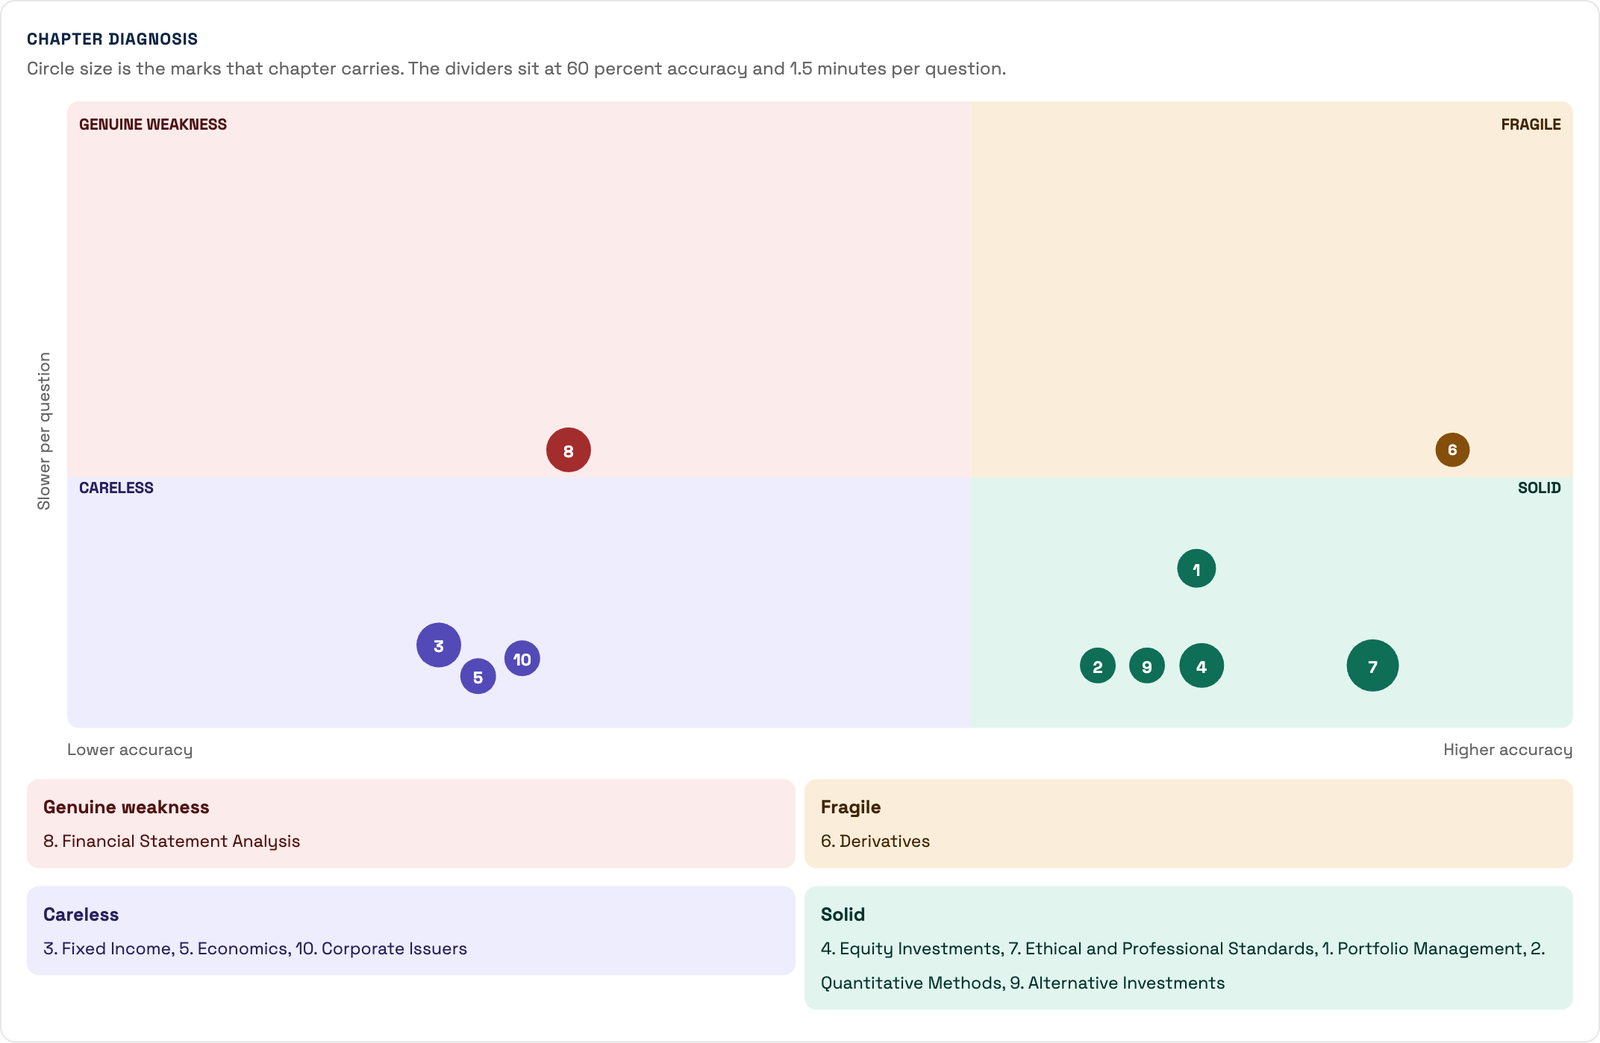
Accuracy runs across the bottom. Further right, more of it right.
Time per question runs up the side. Higher up, longer per question.
Every chapter is a circle on it, sized by the marks that chapter carries. A 15 mark topic is a big circle. A 6 mark topic is a small one. So the areas that will actually decide your result are the ones your eye lands on first, which is something a table has never once done for you.
Two lines cross the middle. The vertical one sits at the accuracy you need. The horizontal one sits at the pace the paper allows, which is simply the time limit divided by the number of questions. On CFA Level 1 that is 135 minutes across 90 questions, so 1.5 minutes each.
Four quadrants. And now watch what happens to your four candidates.
Top left. Slow and wrong. This is your first candidate, the one who never properly learned it. Genuine weakness. The material is the problem, and this is the only quadrant on the entire chart where opening the study notes is the right response.
Top right. Slow and right. Your second candidate, the one who could explain it over coffee but froze with the clock running. Fragile. On a percentage table she looks like a strength, which is exactly what makes her dangerous, because in the hall that hesitation becomes a wrong answer. Drill her for speed. Do not send her back to the chapter she already understands.
Bottom left. Fast and wrong. Your third candidate, racing, missing the word “not”. Careless. No knowledge gap whatsoever. The fix costs him no study time at all. It costs him thirty seconds a question.
Bottom right. Fast and right. Solid.
Your fourth candidate, the one who never reached the question, does not appear on this chart at all. She gets a line of her own further down, and it is the one that tends to surprise people most.
Four candidates who had identical report cards ten minutes ago, standing in four different quadrants, each holding different instructions.
The quadrant nobody looks at
The bottom right deserves a moment, because it is the one every candidate scrolls straight past and it is the one that changes your fortnight.
Fast and right means you have this. Under time pressure. Cold.
Every hour you spend there is an hour taken from somewhere that is genuinely costing you marks.
Every report card in this market is built to tell you what to study. Almost none of them will tell you what to stop studying. And when you are six weeks out, holding down a full time job, and rationing evenings, being told to walk away from something is worth more than being handed another list.
The derivatives chapter you have been rereading since Tuesday. There is a real chance it is sitting in the bottom right, solid and fast and long since handled.
The arithmetic underneath
There is one more thing the chart fixed, and it hides in how weak areas get ranked.
The standard topic table sorts by percentage. Lowest score at the top, in red. It sounds obviously correct.
Run the numbers on a hundred mark paper.
Chapter 1 is worth 5 marks. You scored 20 percent. Alarming. Straight to the top of your list.
Chapter 3 is worth 20 marks. You scored 45 percent. Middling. Sits quietly in the middle where you ignore it.
Chapter 1 cost you 4 marks. Chapter 3 cost you 11.
Chapter 3 is close to three times the problem, and your report card sent you to Chapter 1.
This is not a curiosity. It happens on every paper where chapters carry different weights, which is every paper worth sitting. CFA Level 1 gives Ethics roughly triple the weight of Derivatives. NISM Series VII puts 20 marks on broking operations and 5 on the introductory chapter. A percentage column flattens all of that into a single misleading ranking.
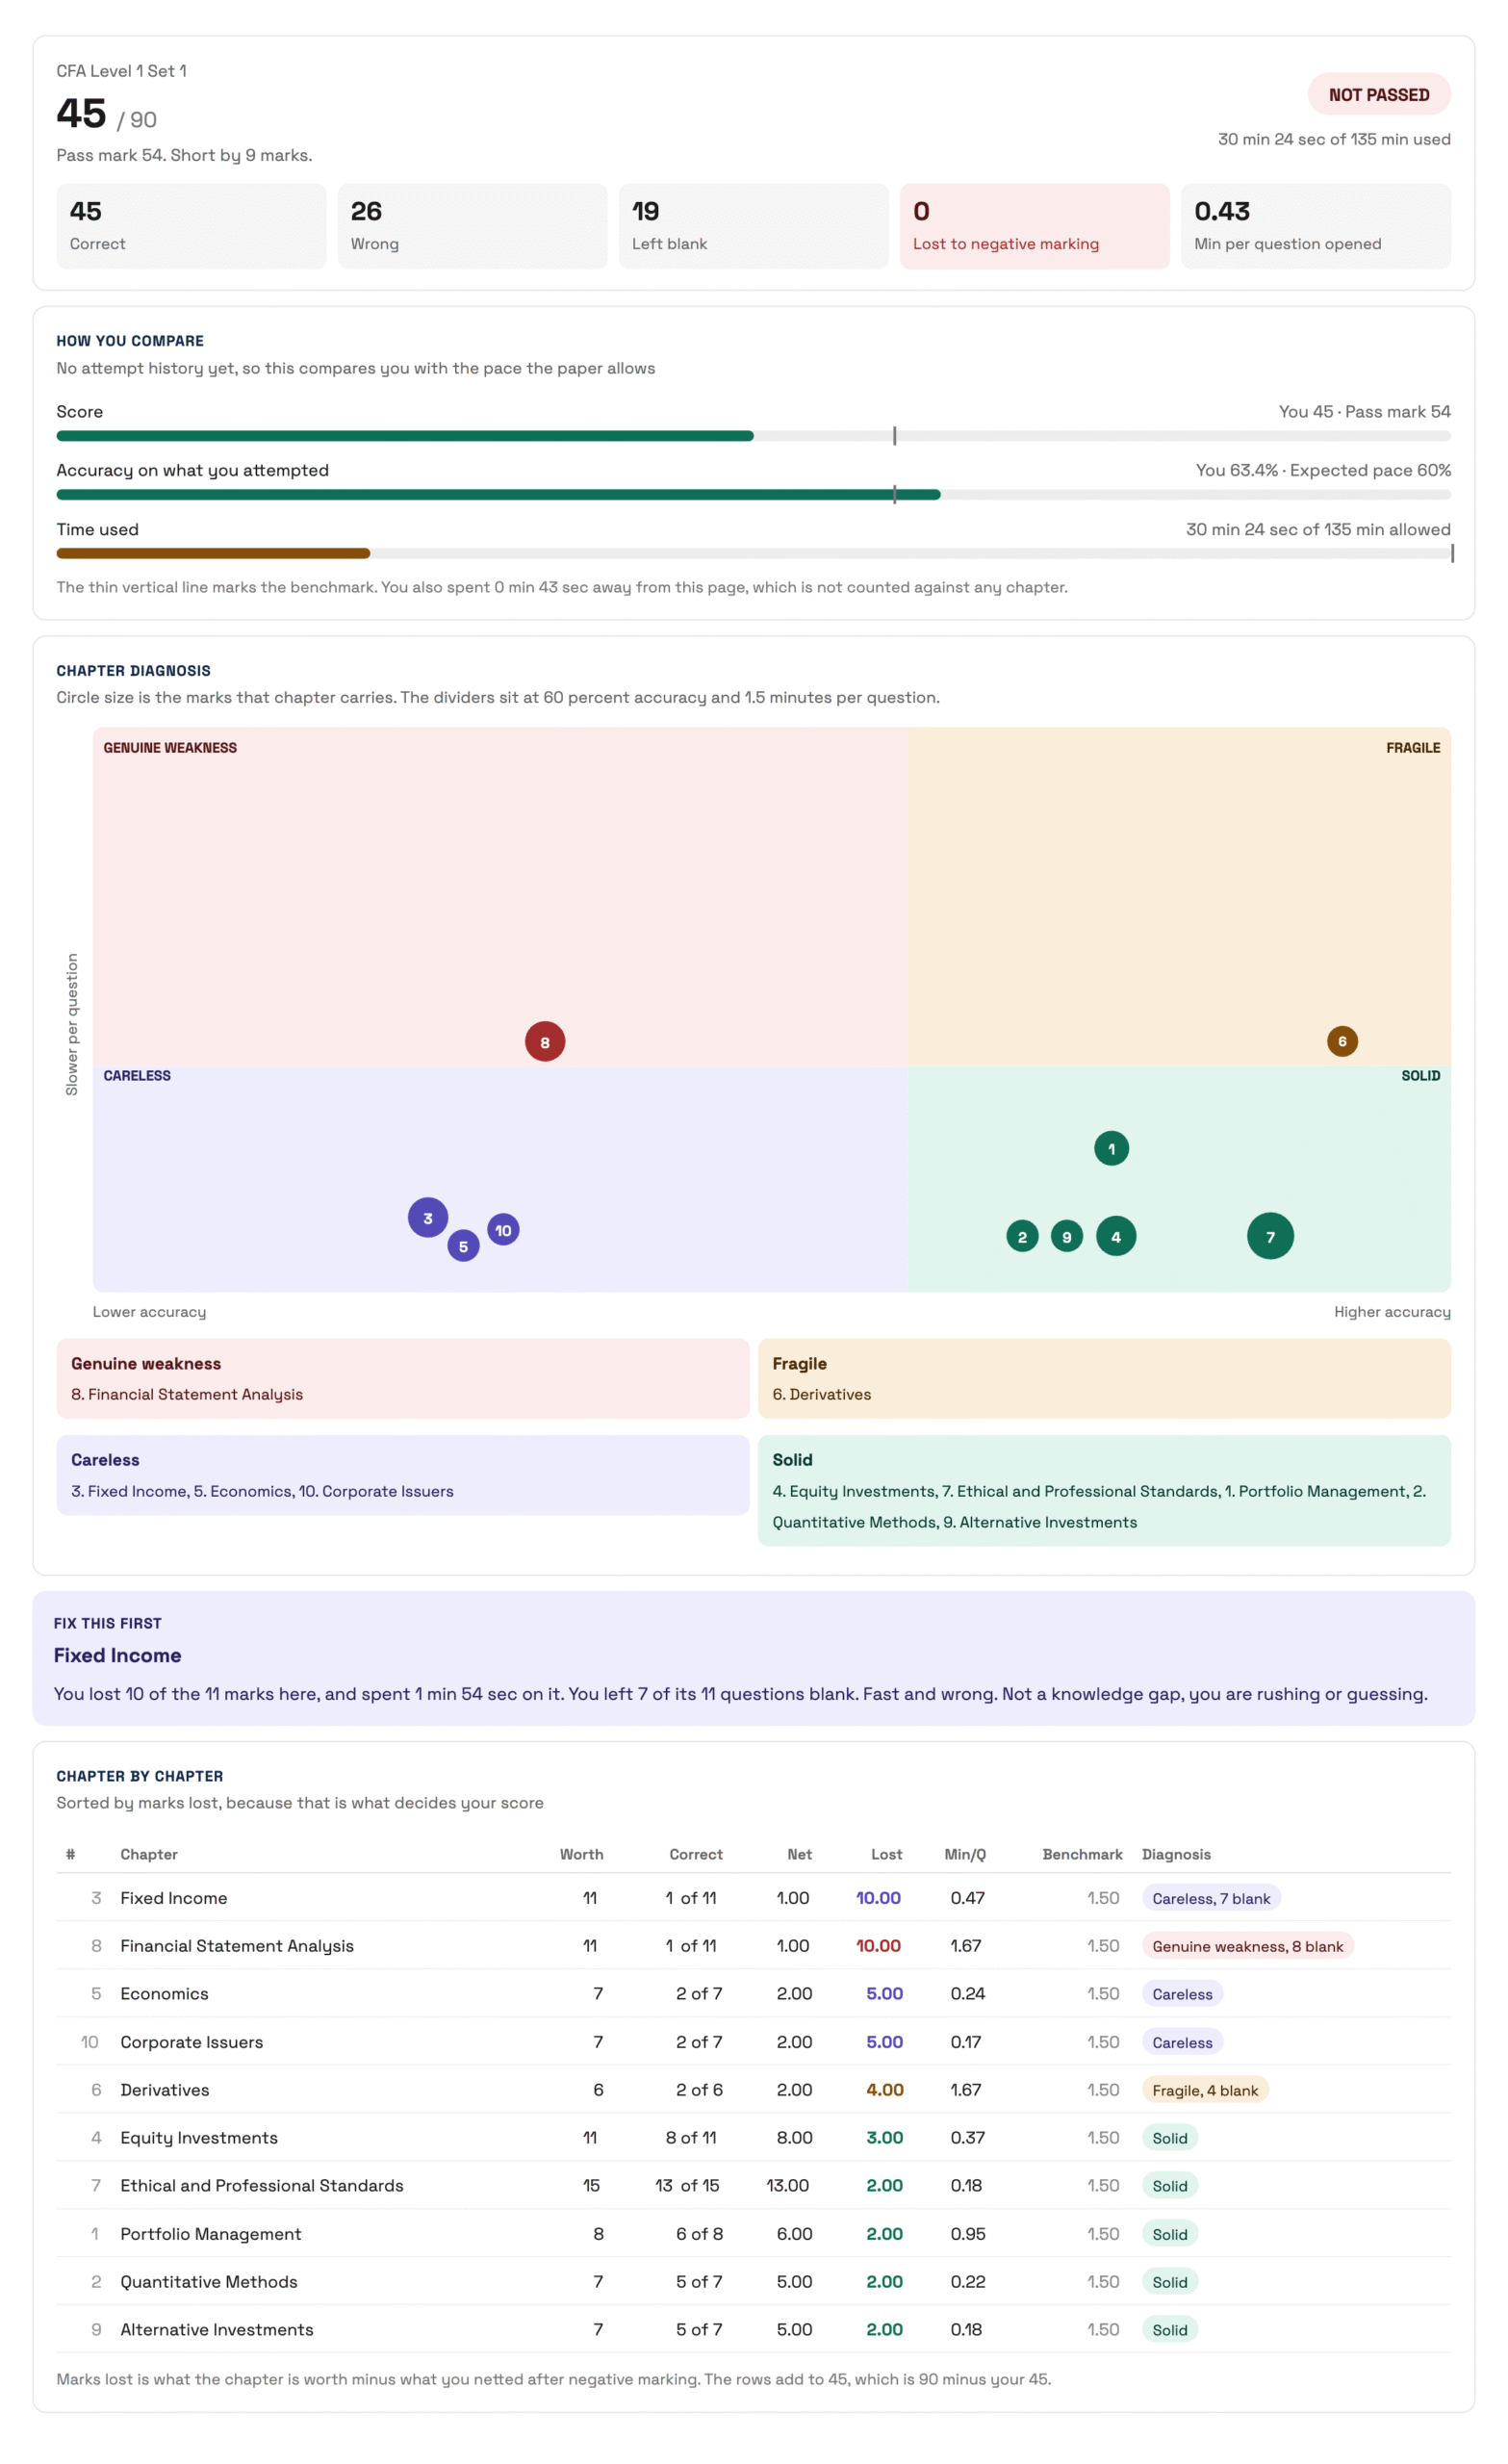
So the table under the chart ranks by the marks you actually lost, after negative marking. The chapter at the top is the one that cost you most, with a plain line telling you why it is there.
And what your blanks were really worth
“You left 6 questions unanswered” is a count. It tells you nothing.
“Those 6 were worth 8 marks, they sat in a chapter where you were getting 80 percent right, and you ran out of time before you reached them” is an entirely different sentence. It tells you that you had no knowledge problem there at all. You had a pacing problem, and it cost you 8 marks you were fully capable of earning.
Candidate four, the one who never appeared on the matrix, finally visible.
How the clock actually works
Worth being precise, because a chart is only as honest as the number behind it.
The clock starts when a question appears and stops the moment you leave it. Come back later and it starts again, and the visits are added together, so a question you returned to three times shows the whole of what it took from you.
Switch away from the browser tab and it pauses. Time away from the page is tracked separately and never charged to any chapter. A phone call in the middle of your mock will never be recorded as difficulty.
And one point of honesty about that horizontal line. Until enough people have sat a given paper, it sits at the pace the paper itself allows, and it is labelled “expected pace” rather than “average”, because calling something an average when we do not have one would be a lie told with a straight face. Once a paper has enough attempts behind it, it switches to the real figure and relabels itself. You can always see which one you are being measured against.
Six weeks from now
You will sit the real paper, and you will have spent roughly forty evenings getting there.
The difference between passing and sitting it again is rarely the number of evenings. It is almost always which chapters got them.
Set 1 is free on every paper we publish. CFA Level 1 and Level 2, FRM Part 1 and Part 2, all 23 NISM modules, Insurance IC 38 and Bank PO. No card, no trial period.
Sit one. End it. Look at where your chapters land.
If derivatives turns out to be sitting in the bottom right quadrant, solid and fast and finished with, then tonight is the last night you spend on it.